Enterprise AI Analytics Platform

AI-Powered Insights. Real-Time Decisions. Across Every Vertical.

IRIS connects your data, governs your KPIs, and delivers actionable intelligence through a conversational AI assistant, live monitoring boards, and domain-specific analytics — for enterprise and government across GCC & MENA.

Explore Platform Download Brochure
108+
Platform Features
10
Industry Verticals
< 3s
AI Response Time
AR + EN
Fully Bilingual
AI Assistant
LUMA
The intelligence layer of IRIS

IRIS sees.
Luma illuminates.

Ask questions in Arabic or English. Get instant answers grounded in your real data — no SQL, no BI training, no waiting.

lumen — Latin for light لُمعة — Arabic for gleam AR + EN Bilingual Voice Input Grounded · No Hallucination
"IRIS is the eye that sees all your data. Luma is the light that makes it visible. Without light, the eye cannot function."
Luma
Online · Connected to your data
What were the top 3 performing regions last quarter?
Based on Q3 data: (1) Kuwait City — 34% of revenue, ↑8% QoQ. (2) Riyadh — 28%, ↑12% QoQ. (3) Dubai — 19%, ↑5% QoQ. Shall I break this down by product category?
ما هي المؤشرات التي تجاوزت الهدف هذا الشهر؟
تجاوزت 4 مؤشرات الهدف هذا الشهر: معدل الاحتفاظ بالعملاء (94%)، صافي نقاط الترويج (72)، وقت الاستجابة (8 دقائق)، ومعدل إتمام المكالمات (87%).
🔍SQL from natural language
📊Auto chart + narration
🎙️Voice input (Custom ASR)
📚Knowledge base RAG
🔒Tenant-scoped only
🤖Agent builder
LiveBoards

Not a dashboard.
A LiveBoard.

A LiveBoard is a living, communicating workspace — not a static report. Every widget is connected to a live data channel with configurable thresholds, AI narrative, and multi-channel alerts.

Traditional Dashboard
Static. Passive. Read-only.
  • Built by IT, consumed by users
  • Fixed refresh schedule
  • No personalization
  • No proactive alerts
  • No AI explanation
IRIS LiveBoard
Live. Communicating. Yours.
  • Built by any user — no IT
  • Real-time via data channels
  • Personalized per role
  • Email · WhatsApp · Teams alerts
  • Luma AI narrative per widget
📊 KFF Emergency Readiness — Kuwait LIVE
Active Centers
38
of 42 total
Avg Readiness
77%
↑ 3% this week
Open Incidents
4
2 critical
✨ Luma Narrative
Readiness improved 3% this week driven by Farwaniya and Ahmadi centers completing equipment maintenance. 2 critical incidents in Hawalli — nearest qualified center is 4.2 km away with 89% readiness score.
Alert Channels
📧 Email 💬 WhatsApp 🔔 In-App 📱 SMS 🟦 Teams
Platform Features

Everything you need.
Nothing you don't.

108 production-grade features across 15 functional categories — from data ingestion to AI-powered decision support.

🧠
Luma AI Assistant
Natural language analytics in Arabic and English. Generates SQL, charts, and narrative explanations automatically from your real data.
Example
A telecom analyst asks "Which IVR nodes have the highest drop-off?" — Luma queries, builds a funnel chart, and explains which nodes need redesign.
📋
LiveBoards
User-built real-time monitoring workspaces. Each widget connects to a live data channel with thresholds, alert rules, and AI narrative.
Example
A fraud team builds a LiveBoard with 8 widgets — when any metric exceeds threshold, WhatsApp alert fires within 30 seconds.
🏗️
KPI Semantic Layer
Visual KPI designer with formula builder, dimension hierarchies, target tracking, and multi-step approval workflow. One definition, consistent everywhere.
Example
A municipality defines "Asset Utilization Rate" once — formula, dimensions, targets, and owner. Every dashboard and AI answer uses the same definition.
🚨
Early Warning System
Multi-condition alert rules with AND/OR logic, Isolation Forest anomaly detection, escalation chains, and alert analytics. Proactive — not reactive.
Example
Alert fires when fraud rate >3% AND volume >10,000 in any 1-hour window — escalates to fraud manager and auto-creates an investigation ticket.
Data Quality Index
6-dimension automated quality scoring: completeness, accuracy, timeliness, consistency, uniqueness, and validity. Auto-recomputes with drill-down to field level.
Example
12% of citizen records have missing phone numbers. DQI flags this, Luma explains the impact on SMS delivery, and a remediation task is auto-created.
🗺️
GIS & Geospatial AI
Google Maps integration with KPI heatmaps, choropleth layers, clustering, and AI-powered incident response scoring. Click the map to trigger spatial analytics.
Example
KFF: click any location on Kuwait map → enter incident type → IRIS scores all 42 centers by skills, equipment, distance, staff → recommends top 3 responders.
📈
Forecasting & Anomaly Detection
ARIMA/SARIMA time-series forecasting with MLflow experiment tracking. Isolation Forest anomaly detection with explainability and confidence intervals.
Example
A mining company forecasts phosphate production for 6 months. Model confidence: 94%. Anomaly detected: production dip in Week 23 — traced to maintenance schedule.
🛡️
Fraud Detection & AML
ML-based fraud scoring with velocity checks, merchant risk profiling, network analysis, and AML compliance monitoring. Case management with investigation workflow.
Example
Merchant with 340% velocity spike in 2 hours. Fraud score: 94/100. System auto-flags, creates a case, notifies analyst, and suggests blocking pending review.
🎙️
ASR Voice Bot Analytics
Arabic + English speech recognition analytics. Track WER/CER, intent recognition rates, language-switching patterns, fallback/escalation analysis, and call outcome intelligence.
Example
A bank's Arabic voice bot has 78% intent accuracy. IRIS identifies the top 12 misunderstood intents and recommends training data additions to reach 92%.
🛒
FMCG & Retail Intelligence
Sales analytics by SKU/region/channel, distribution coverage, promotions ROI, shelf intelligence, supply chain KPIs, and demand forecasting.
Example
FMCG distributor tracks 1,200 SKUs across 8 regions. IRIS identifies 3 SKUs causing 67% of stockouts and forecasts a 23% demand spike in Ramadan.
🔌
Multi-Source Connectors
Connect DuckDB, PostgreSQL, MySQL, SQL Server, Oracle, REST APIs, Excel/CSV, and cloud warehouses. Incremental ELT with lineage tracking and schema versioning.
Example
Telecom connects Oracle billing + PostgreSQL CRM + REST API for network KPIs + Excel for budget targets — all unified in one semantic layer.
🤖
Agent Builder
Build custom AI agents with defined tools, scopes, and guardrails. Agents query data, trigger alerts, generate reports, and interact with external systems — all audited.
Example
A "Daily Risk Briefing" agent runs every morning at 7am: queries overnight transactions, identifies top 5 risk patterns, generates a PDF, and emails the risk committee.
Data Integration

Connect any data source.

IRIS meets your data where it lives — no migration required. Incremental ELT, lineage tracking, and schema versioning out of the box.

🐘
PostgreSQL
Relational DB
🐬
MySQL / TiDB
Relational DB
🏢
SQL Server
Enterprise DB
🔶
Oracle
Enterprise DB
🦆
DuckDB
Analytics Engine
☁️
Azure Synapse
Cloud Warehouse
📡
REST APIs
Web Services
📊
Excel / CSV
File Sources
Data Flow — Source to Intelligence
🗄️
Source Systems
DB · API · Files
⚙️
ELT Pipeline
Incremental · Lineage
🏗️
Data Warehouse
Curated Marts
📐
Semantic Layer
KPIs · Dimensions
📊
LiveBoards
Real-time · Alerts
🧠
Luma AI
NL · Voice · Agents
Industry Verticals

Built for your industry.

IRIS is not a generic BI tool. Each vertical receives a purpose-built analytics experience — domain-specific KPIs, workflows, and AI models.

Banking, Fintech & Payment Processing

Real-time fraud detection, AML compliance monitoring, transaction analytics, and risk intelligence for banks, payment processors, and fintech companies across GCC and MENA.

  • ML-based fraud scoring with velocity checks and merchant risk profiling
  • AML transaction monitoring with suspicious activity reporting
  • Card portfolio analytics — approval rates, decline reasons, chargeback trends
  • Merchant performance and risk segmentation
  • Real-time EWS alerts with case management workflow
Sample KPIs
Fraud Rate2.4%▼ Target <3%
AML Alerts / Day47▲ +12%
Chargeback Rate0.8%▼ -0.2%
Approval Rate94.2%▲ +1.1%
Avg Fraud Score31/100▼ Low risk

Telecom — IVR, Roaming & ASR Analytics

End-to-end analytics for telecom operators — from IVR call journey intelligence to roaming revenue analytics (RoamIQ) and ASR voice bot performance monitoring.

  • IVR call journey analysis — node-by-node drop-off and completion rates
  • ASR accuracy tracking — WER/CER by language, dialect, and intent
  • Roaming revenue analytics by partner, country, and service type
  • Subscriber segment analysis — language preference, call behavior
  • Network generation performance (2G/3G/4G/5G) by region
Sample KPIs
IVR Self-Service Rate68%▲ Target 75%
ASR Intent Accuracy84%▲ +6% MoM
Agent Transfer Rate22%▼ -4%
Roaming RevenueKWD 2.4M▲ +18% QoQ
Avg Handle Time3m 42s▼ -18s

Government & Public Sector

KPI governance, PMO portfolio management, citizen service analytics, and GIS-integrated spatial intelligence for government agencies, municipalities, and programme offices.

  • PMO portfolio — project health, milestone tracking, budget vs actual
  • Citizen service analytics — response times, satisfaction, complaint resolution
  • GIS-based KPI heatmaps by district, governorate, or zone
  • National KPI dashboards with multi-level approval governance
  • Budget execution monitoring with variance alerts
Sample KPIs
Projects On-Track73%▲ +5%
Budget Utilization68%▼ Target 80%
Citizen Satisfaction4.2/5▲ +0.3
Avg Response Time2.4 days▼ -0.8d
KPI Compliance Rate91%▲ +3%

Emergency Services — KFF Fire Force

Real-time operational readiness monitoring, AI-driven incident response recommendations, staff skills management, and equipment availability tracking across all centers.

  • Incident Response Recommender — AI scores all centers for any incident type
  • Center readiness scoring — skills, equipment, staff availability, proximity
  • Staff skills gap analysis — certified vs required per incident type
  • Equipment maintenance and operational status tracking
  • Annual performance reports and training compliance
Sample KPIs
Avg Center Readiness77%▲ +3%
Certified Staff Rate84%▲ +2%
Equipment Availability91%▼ -1%
Response Time (Avg)6.2 min▼ -0.8m
Incident Resolution Rate98.4%▲ +0.4%

FMCG & Retail

Unified view of sales performance, distribution coverage, promotions ROI, and demand forecasting — across all channels, regions, and SKUs — for FMCG manufacturers, distributors, and retailers.

  • SKU-level sales analytics by region, channel, and time period
  • Distribution coverage and stockout detection by area
  • Promotions ROI analysis — uplift vs baseline, cannibalization detection
  • Demand forecasting with seasonal adjustment (Ramadan, holidays)
  • Retailer performance ranking and incentive tracking
Sample KPIs
Distribution Coverage87%▲ +3%
Stockout Rate4.2%▼ -1.1%
Promo ROI+34%▲ +8%
Forecast Accuracy91%▲ +4%
Revenue per SKUKWD 4,820▲ +12%

Asset Management — Municipalities & Utilities

Asset lifecycle analytics, Remaining Useful Life (RUL) predictions, financial exposure modeling, and maintenance optimization — integrating with Maximo and other CMMS systems.

  • Asset portfolio overview — condition, age, category, department
  • RUL prediction — which assets will fail in the next 12 months
  • Financial exposure — replacement cost by risk tier
  • Maintenance budget planning with scenario modeling
  • Data quality monitoring for asset registry completeness
Sample KPIs
Assets at High Risk12%▼ -2%
Avg Asset Age8.4 yrs▲ +0.3
Replacement ExposureAED 42M▼ -8%
Maintenance Compliance88%▲ +5%
DQI Score91/100▲ +3

Mining Operations

Production analytics, financial performance monitoring, and sustainability tracking — with forecasting models for production planning and cost optimization.

  • Production volume analytics by mine, shift, and product type
  • Revenue and cost per tonne with variance analysis
  • Production forecasting (ARIMA + seasonal adjustment)
  • Sustainability KPIs — energy, water, emissions per tonne
  • Equipment utilization and downtime impact analysis
Sample KPIs
Production Volume184K t▲ +7%
Cost per Tonne$28.4▼ -$1.2
Equipment Uptime94%▲ +2%
Forecast Accuracy93%▲ +1%
CO₂ per Tonne0.42 t▼ -0.03
Architecture

Enterprise-grade
from day one.

A layered architecture designed for scalability, security, and governance. Every layer is production-grade — not a prototype.

🔒
RBAC + Audit
Role-based access control with full audit trail on every action
🏠
On-Prem or Cloud
Deploy on your infrastructure or Azure/AWS — your choice
🌐
Multi-Tenant
Isolated tenant environments on a shared governed platform
🔬
MLflow Tracking
All ML experiments tracked, versioned, and reproducible
1
Data Sources
PostgreSQLSQL ServerOracleREST APIsFiles
2
ELT Pipeline & Data Warehouse
Incremental ELTDuckDB MartsLineageDQI
3
Semantic Layer
KPI CatalogDimensionsTargetsApproval Workflow
4
Analytics & ML Layer
ForecastingAnomaly DetectionMLflowFraud Models
5
LiveBoards & GIS
Real-time WidgetsEWS AlertsGoogle MapsHeatmaps
6
Luma AI Assistant
RAGSQL GenerationAgentsVoiceGuardrailsAR+EN
Demo Videos

See IRIS in action.

Watch IRIS demonstrate real analytics scenarios across different industries. Demo videos are being produced.

Watch Demo
IRIS Platform Overview
Complete walkthrough — data connection to LiveBoards, Luma AI, and vertical modules.
⏱ ~5 minutes
Coming Soon
Luma AI — Ask your data anything
Luma AI in Action
Watch Luma answer complex analytics questions in Arabic and English in real time.
⏱ ~3 minutes
Coming Soon
LiveBoards — Build & Alert
Building a LiveBoard
A business user builds a LiveBoard in minutes — widgets, alert channels, and sharing.
⏱ ~4 minutes
Coming Soon
Fraud Detection — Banking Demo
Fraud Detection Demo
Real-time fraud scoring, merchant risk profiling, and AML alert workflow.
⏱ ~6 minutes
Coming Soon
KFF Incident Response — Map Demo
KFF Incident Response AI
Click on Kuwait map, enter incident type, watch IRIS score all centers and recommend the optimal response team.
⏱ ~4 minutes
Coming Soon
ASR Voice Bot Analytics
Arabic + English call bot performance — intent accuracy, dialect confusion, escalation analysis.
⏱ ~5 minutes
Feature Showcase

See IRIS in the real world.

Real screens. Real data. Real decisions — from LiveBoards to root-cause causal trees, these are actual IRIS features in production.

LiveBoard + Slice by Dimension
Bulletin Board — AI Collaboration
Bulletin Board — Intelligence Feed
KPI Relationship Designer — Canvas
KPI Relationship Designer — List
Root Cause Analysis — Tree
Root Cause Analysis — List
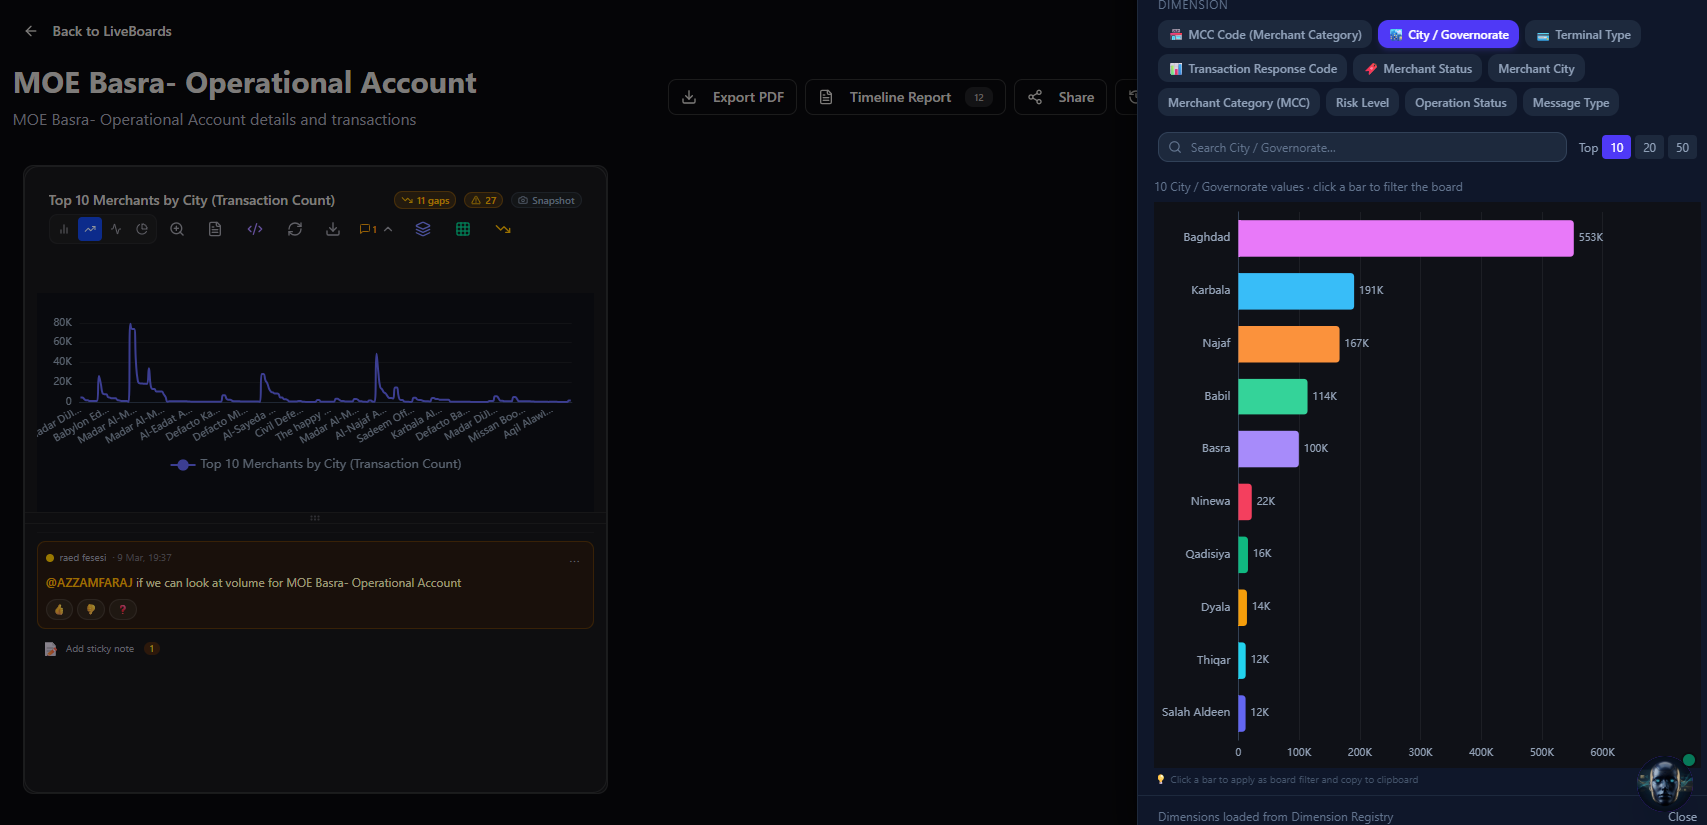
IRIS LiveBoard with Slice by Dimension panel
LiveBoard
LiveBoards

Slice any dimension.
Instantly.

This is a live MOE Basra Operational Account board. The user clicked a dimension — City/Governorate — and the entire board filtered in real time. Baghdad: 553K transactions. Karbala: 191K. Every widget on the board responded simultaneously.

9+
Dimension types
0ms
Filter propagation
Widgets per board
Dimension Registry Board-wide filter Sticky notes Export PDF Timeline Report Share
Not a dashboard — a LiveBoard
Bulletin Board

Where data meets
conversation.

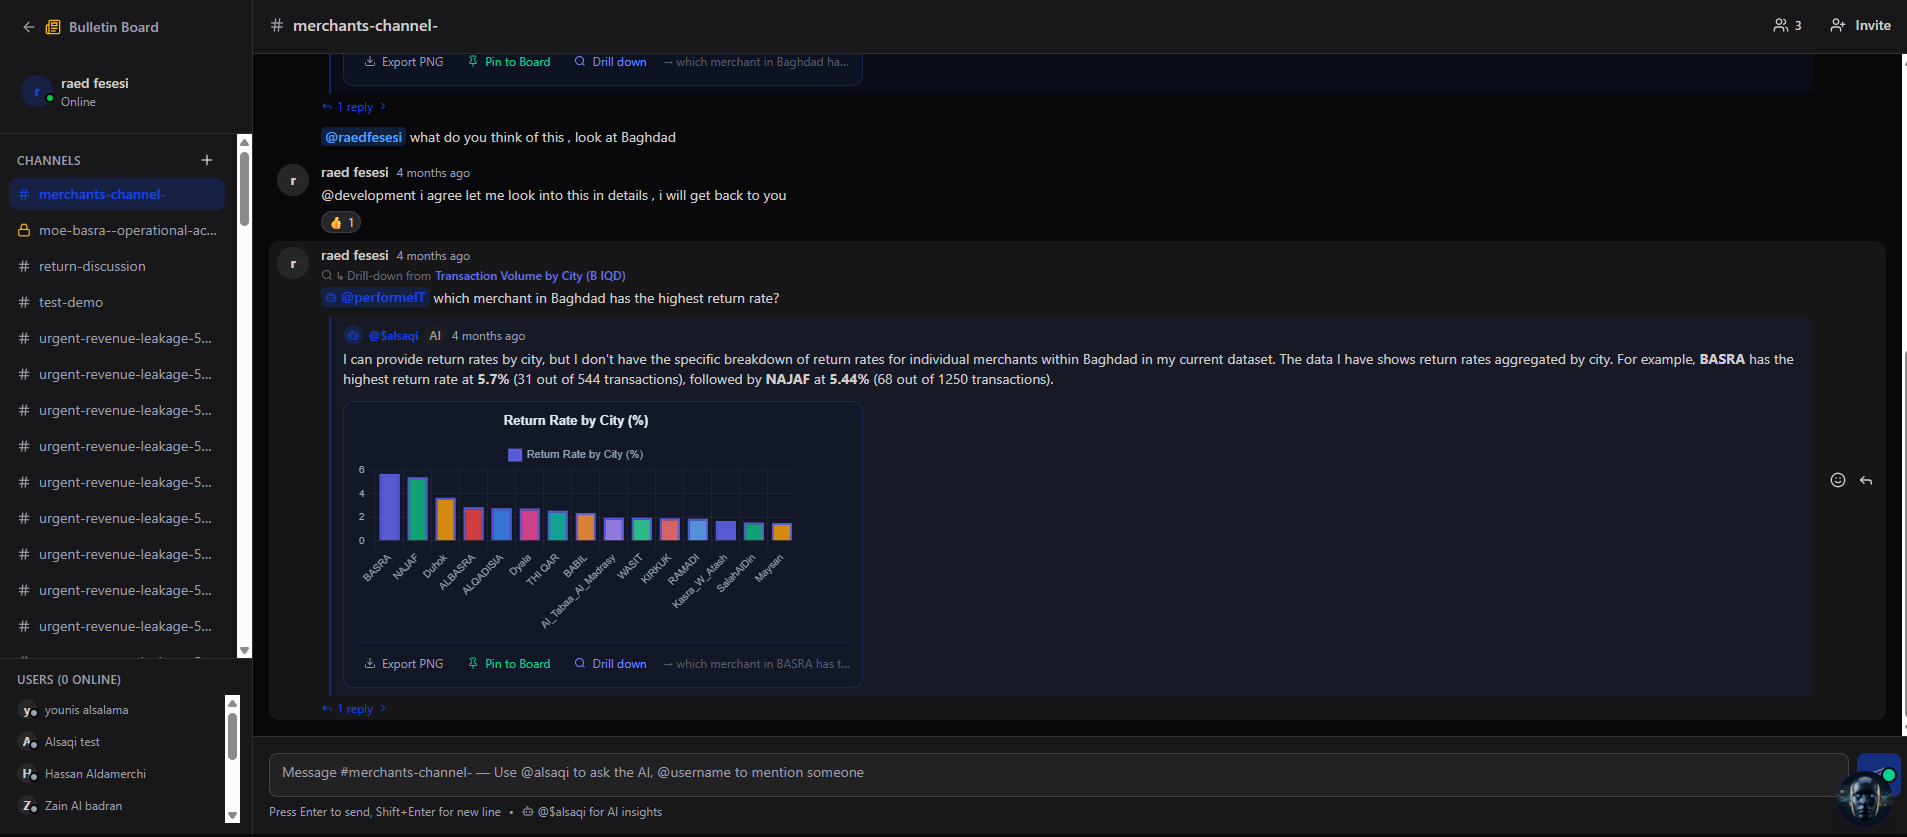
A team member asks: "which merchant in Baghdad has the highest return rate?" — @alsaqi (Luma AI) responds inline with a chart, causal narrative, and a drill-down link. No context switching. No separate BI tool. The insight lives in the conversation.

@alsaqi
Mention AI in any channel
Pin
Charts to LiveBoard
AI inline response Drill-down from chat Export PNG Pin to Board @mention team Channel threads
Analytics inside the conversation
IRIS Bulletin Board with AI inline chart response
Bulletin Board
IRIS Bulletin Board intelligence feed
Intelligence Feed
Bulletin Board — Feed

Your personalised
intelligence feed.

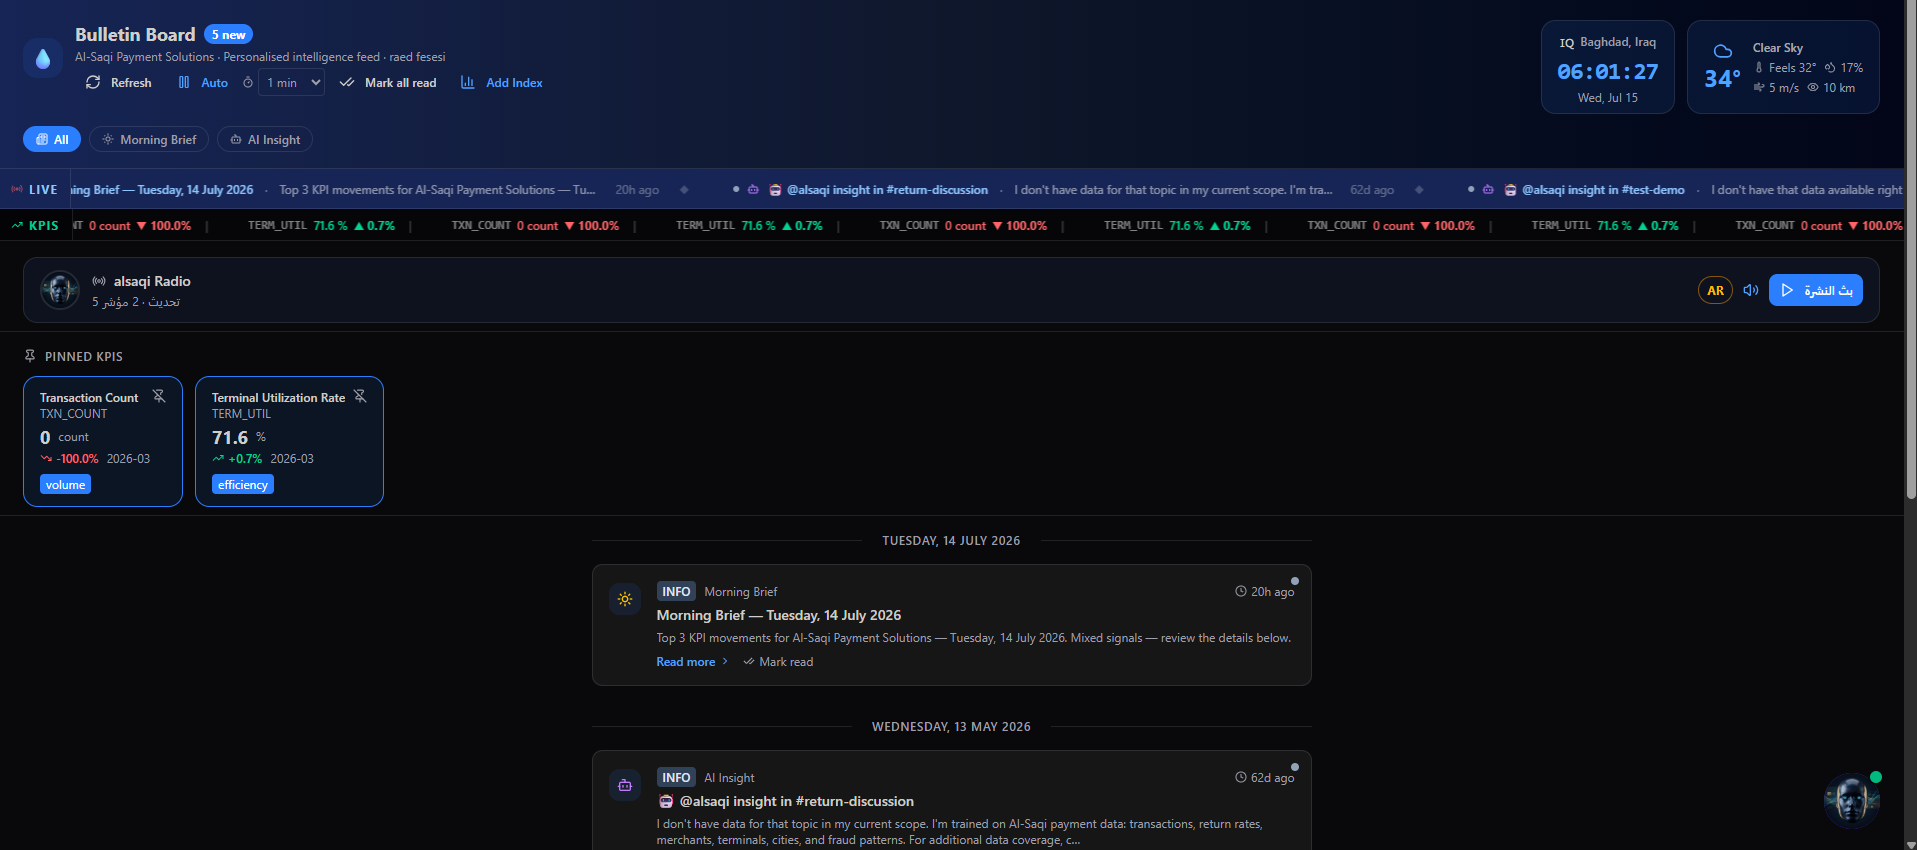
Every morning, IRIS delivers a Morning Brief — top 3 KPI movements, anomalies, and AI insights — directly to your feed. Live KPI ticker scrolls across the top. Pinned KPIs show real-time values. Alsaqi Radio broadcasts the brief in Arabic audio.

1 min
Auto-refresh interval
AR
Audio broadcast
LIVE
KPI ticker
Morning Brief Alsaqi Radio Pinned KPIs AI Insight cards Weather widget Live ticker
Intelligence, not information overload
KPI Relationship Designer

Map every KPI
relationship.

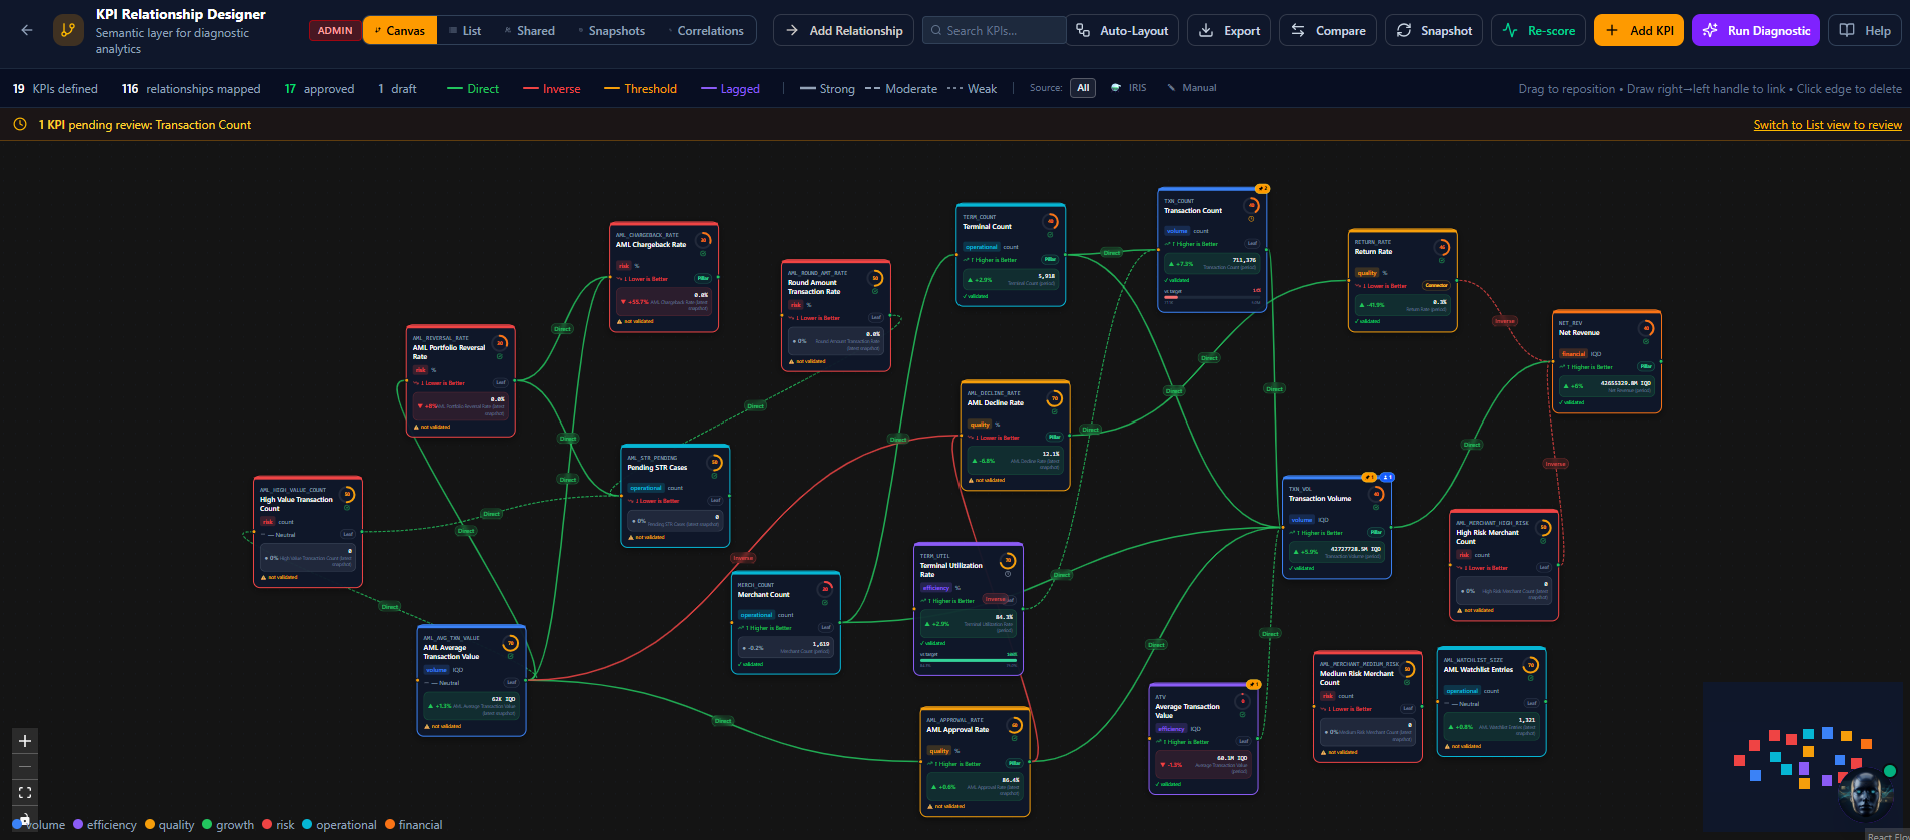
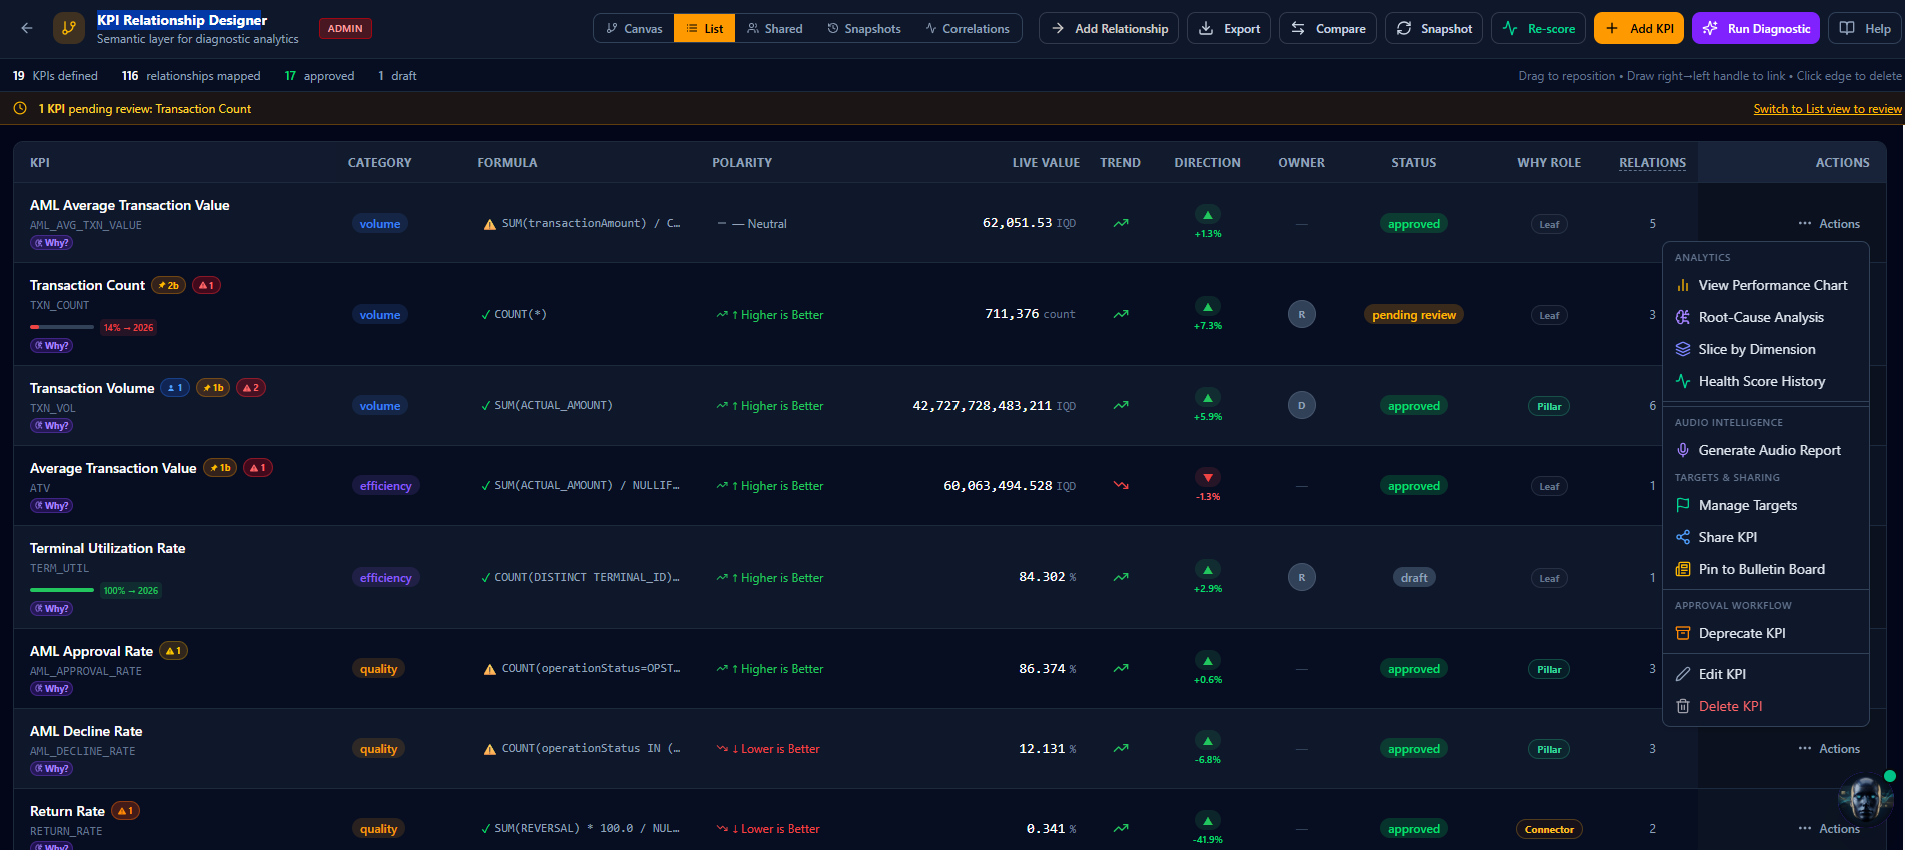
19 KPIs. 116 relationships. Mapped, validated, and approved. The canvas shows every causal connection — Direct, Inverse, Threshold, Lagged — with edge thickness representing causal path weight. This is the semantic backbone that powers root-cause analysis.

116
Relationships mapped
17
Approved
6
KPI categories
Causal graph Auto-Layout Direct / Inverse Threshold / Lagged Strong / Moderate / Weak Correlations view
The semantic layer behind every insight
IRIS KPI Relationship Designer canvas view
KPI Designer — Canvas
IRIS KPI Relationship Designer list view with actions menu
KPI Designer — List
KPI Relationship Designer

Every KPI.
Fully governed.

The list view shows every KPI with its formula, polarity, live value, trend, direction, owner, approval status, and relationship count. The Actions menu exposes Root-Cause Analysis, Slice by Dimension, Generate Audio Report, and Pin to Bulletin Board — all from a single row.

711K
Live transaction count
+7.3%
Trend this period
Approval workflow Root-Cause from row Audio Report Pin to Board Health Score Why Role (Leaf/Pillar)
Governed KPIs, not spreadsheet metrics
Root Cause Analysis

Why did this
KPI move?

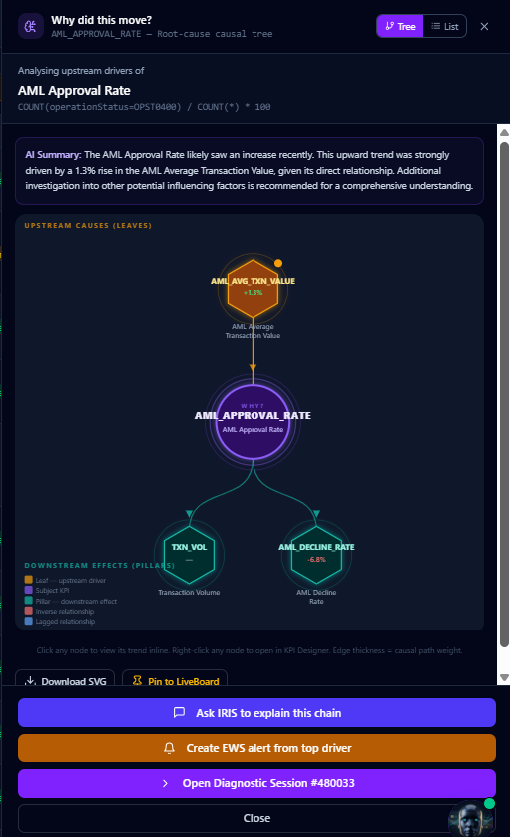
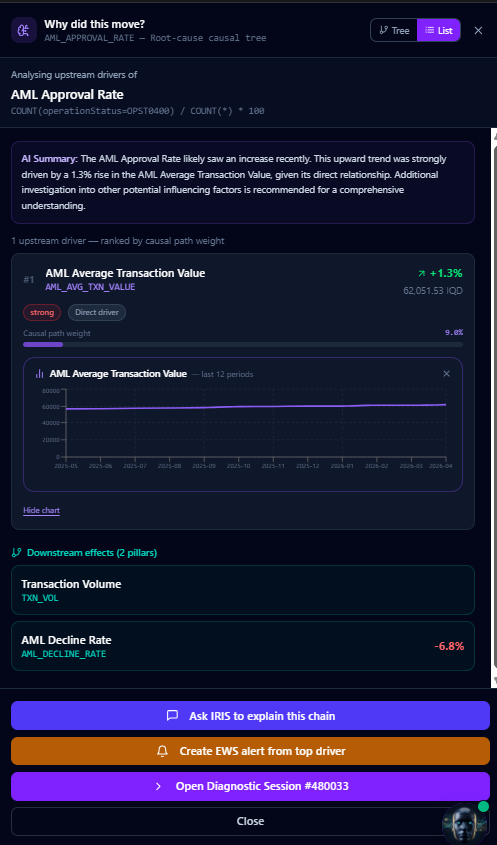
AML Approval Rate moved. IRIS traces the causal chain — upstream driver: AML Average Transaction Value (+1.3%, causal path weight 9.0%). Downstream effects: Transaction Volume and AML Decline Rate (-6.8%). One click: Ask IRIS to explain, Create EWS Alert from the top driver, or Open a Diagnostic Session.

9.0%
Causal path weight
+1.3%
Top driver movement
Causal tree AI Summary Ask IRIS to explain Create EWS Alert Diagnostic Session Download SVG
From symptom to root cause in seconds
IRIS Root Cause Analysis causal tree
Root Cause — Tree
IRIS Root Cause Analysis list view with causal path weights
Root Cause — List
Root Cause Analysis

Ranked drivers.
Quantified impact.

The list view ranks every upstream driver by causal path weight with trend sparklines for the last 12 periods. Downstream effects (pillars) are listed with their current values. Every driver is tagged Strong or Direct — so analysts know exactly where to focus.

#1
Driver ranked by causal weight
12
Periods of trend history
Causal path weight Trend sparkline Strong / Direct tags Downstream pillars Ask IRIS Create EWS Alert
Quantified causality, not guesswork
Resources

Download the IRIS Brochure

Get the full IRIS platform overview — features, verticals, pricing tiers, and contact information. Available in English and Arabic.

📄
IRIS Platform Brochure
Complete feature overview, industry verticals, pricing tiers, and platform architecture. English version.
Download English (PDF)
📄
كتيب منصة IRIS
نظرة شاملة على المنصة — الميزات والقطاعات ونماذج التسعير والبنية التقنية. النسخة العربية.
تحميل النسخة العربية

Ready to see IRIS with your data?

Request a personalized demo or proof of concept. Most POCs are live within 2 weeks.